

Principal Solutions Engineer at Grafana Labs
Observability for Microcks at scale
As part of the upcoming 1.9.0 release of Microcks, I’m super proud to have contributed new features related to its observability and performance monitoring! As supporting the Open Source ecosystem is part of my day job at Grafana Labs, I was really excited by this collaboration with the Microcks project to put into practice the use of OpenTelemetry, a project that is also part of the CNCF.

Why it matters?
Microcks can be used and deployed in many topologies: from ephemeral instances with few APIs & services to always-up-and-running instances serving complex ecosystems of APIs in large organizations. Within this wide range of use cases, Microcks can also be used in:
- Short-lived instances such as on-demand sandboxes,
- Quality Assurance environments,
- Performance testing environments.
For deployments at scale, the project received the usual questions from the community:
- How much can a single Microcks instance handle?
- Can I use it for very large performance testing campaigns?
- How does it scale?
The maintainers needed to be able to provide the proper insights with the right tooling to answer these questions. The first step would be to be able to accurately measure the performance of Microcks to get a grasp of what a single instance could really deliver . In addition, some large organizations running Microcks and having it as a mainstream solution started to be concerned about the upgrades. Hence, those legit questions:
- Is the new
1.8.0release lighter and better than the previous one? - Should I upgrade my MongoDB engine for better performance?
- Will it bring some performance degradation?
Those questions fall into the realm of continuous improvement. Therefore, the second requirement this contribution covers is understanding where errors or performance degradation could come from to facilitate code optimizations.
Microcks already provided Prometheus endpoints for metrics but to get deeper insights, it is necessary to also collect logs and traces. Furthermore, there needed to be a way to generate load in order to help with the capacity provisioning of Microcks instances.
What’s in the box?
As part of the CNCF ecosystem, it was a natural decision with the maintainers that the way to go was to provide a comprehensive integration with the OpenTelemetry initiative. OpenTelemetry is a collection of APIs, SDKs, and tools that provide an open, vendor-agnostic way to instrument, generate, collect, transform, and export telemetry data.
In addition to the Prometheus endpoints still present, Microcks 1.9.0 can now be deployed with OpenTelemetry instrumentation. With that configuration enabled, the metrics, logs, and distributed traces produced by Microcks can be sent via OTLP (OpenTelemetry Line Protocol) to any OpenTelemetry Collector service. Enabling this configuration is very straightforward, you just have to set two environment variables during Microcks’ deployment:
OTEL_JAVAAGENT_ENABLEDmust be set totrue, this activates the OpenTelemetry instrumentation with the OpenTelemetry Java Agent.OTEL_EXPORTER_OTLP_EXPORTmust be set to a collector URL like[http://otel-collector.acme.com:4317](http://otel-collector.acme.com:4317). By default, it uses the OTLP/GRPC protocol.
You can check the project’s OpenTelemetry documentation for more information.
Aside from the telemetry data collection, with this contribution, Microcks also provides a comprehensive Grafana dashboard. That way you get a direct digest of all the collected information with instant access to performance metrics per mock endpoints, including TPS and response time percentile information. The backends used here to store the telemetry data on which the Grafana Dashboard is built are Prometheus for the metrics, Loki for the logs, and Tempo for the traces. This enables seamless correlation of all 3 telemetry signals to analyze performance trends, discover potential issues, and identify bottlenecks.
You can check the project’s Grafana documentation for more information
Finally, as generating load on Microcks can be complex for new users, we also added a benchmarking suite to Microcks 1.9.0! Easy to go for beginners, this suite allows you to simulate Virtual Users on different usage scenarios and gather raw performance metrics of your instance. Thanks to the K6 load and performance testing suite, it’s easy to run and tune to generate a load representative of your expected usage (browsing / invoking REST mocks / invoking Graph mocks / etc..)
Note that you can use this benchmark suite without necessarily enabling the OpenTelemetry and Grafana features. You can check the project’s Benchmark documentation for more information.
Walkthrough
Want to see all of this in action? Then, go through our guided tour just below.
We will start hereafter with the Microcks Grafana dashboard displaying the metrics and the logs. You’ll see that we have used the popular RED method - (short for rate, error, and duration) - to structure this dashboard. This gives an overview of the performance & general behavior of each mock service. Users can now correlate metrics logs and traces to better understand how mocks behave. Using the timeline it is possible to narrow to problematic timeframes, focus on a small set of logs, and analyze the corresponding traces. You’ll also get the response time distribution and their percentiles.
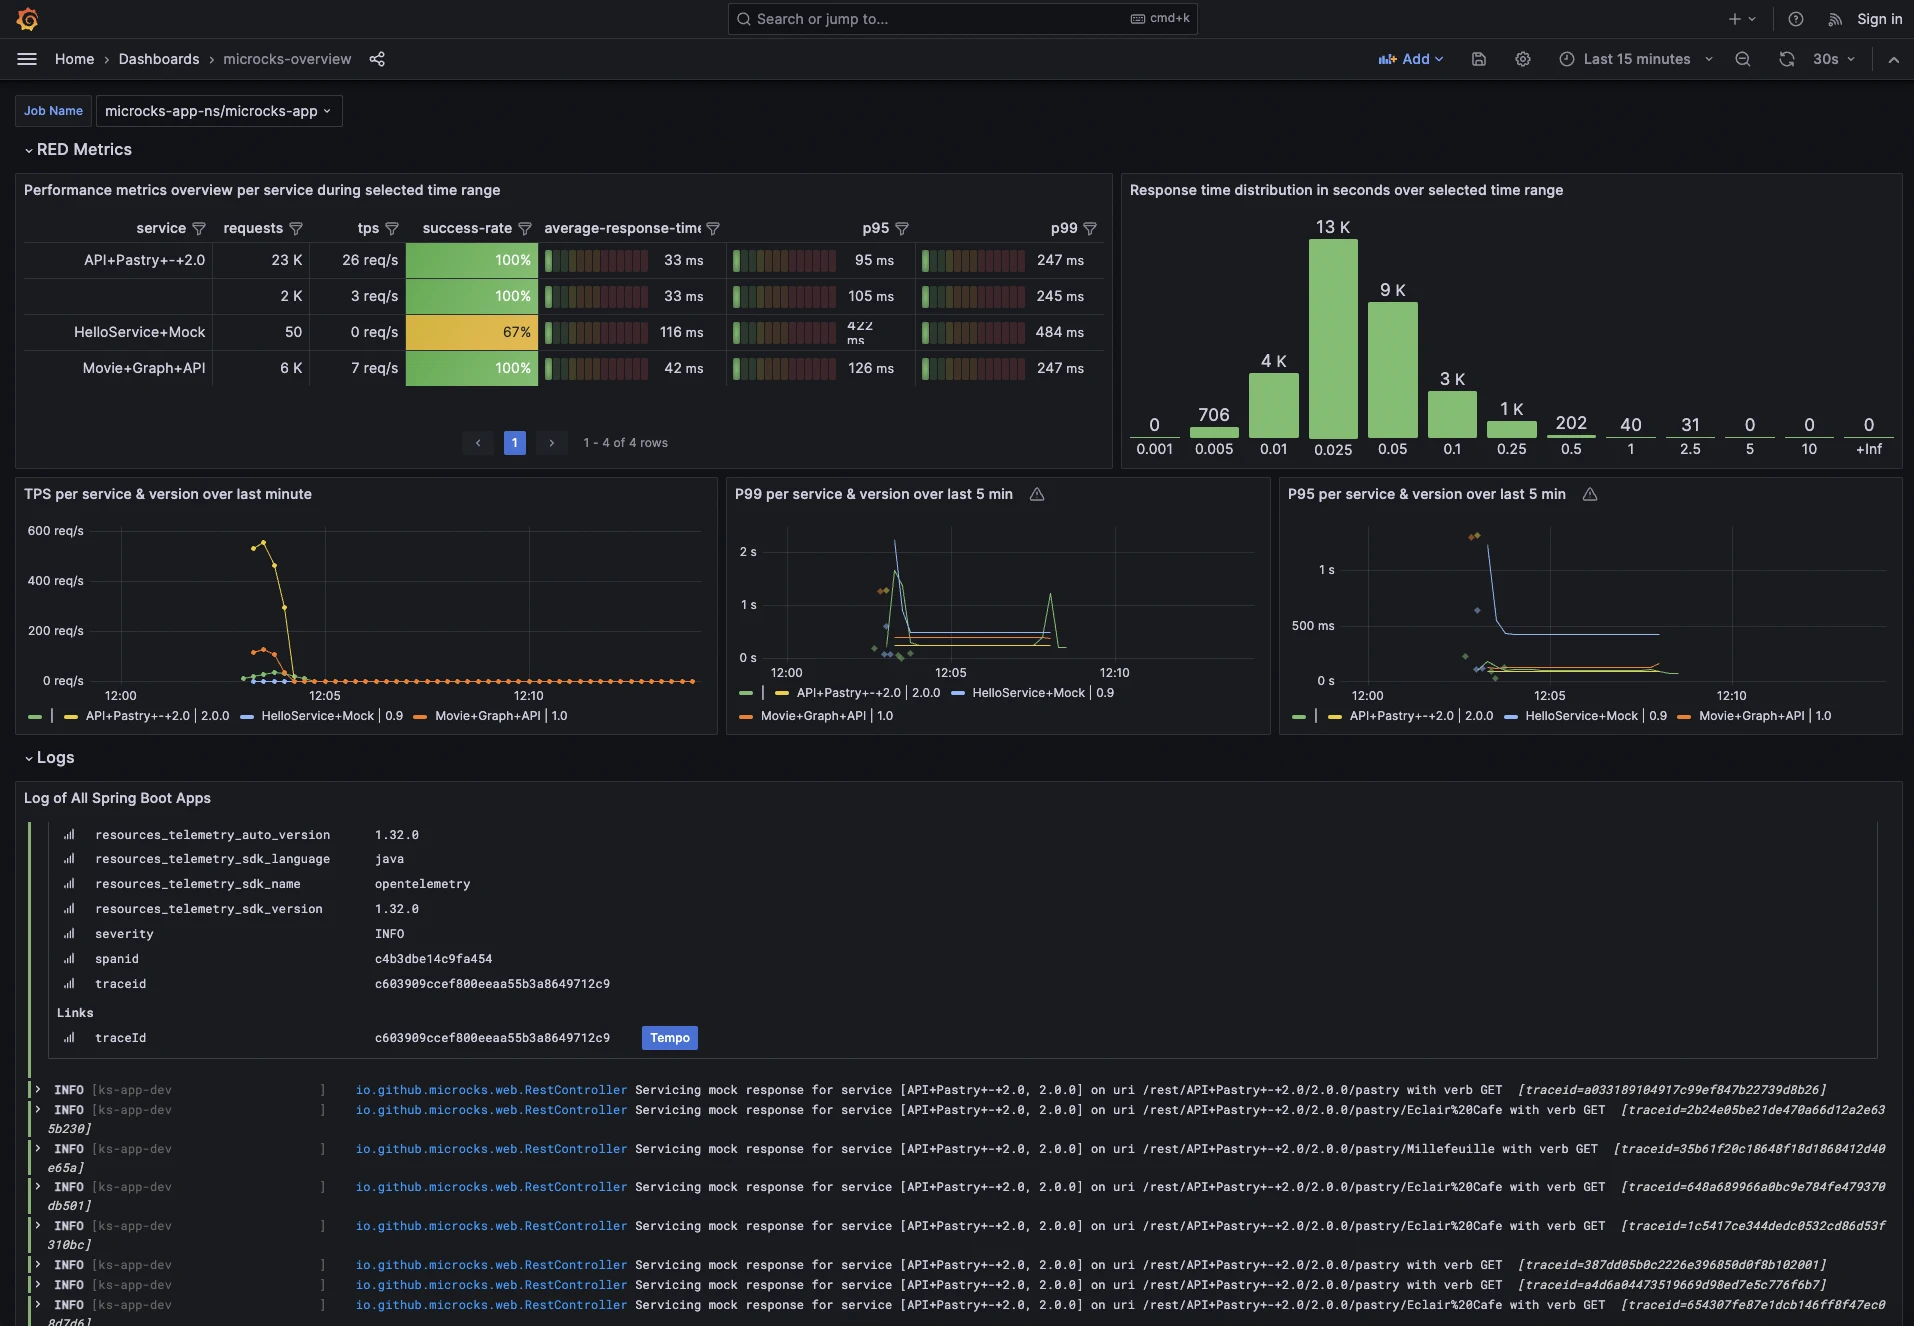
The percentile panels show little dots that link to examples of traces that have a certain response time. This allows the user to isolate significant traces that represent a potentially problematic execution easily.
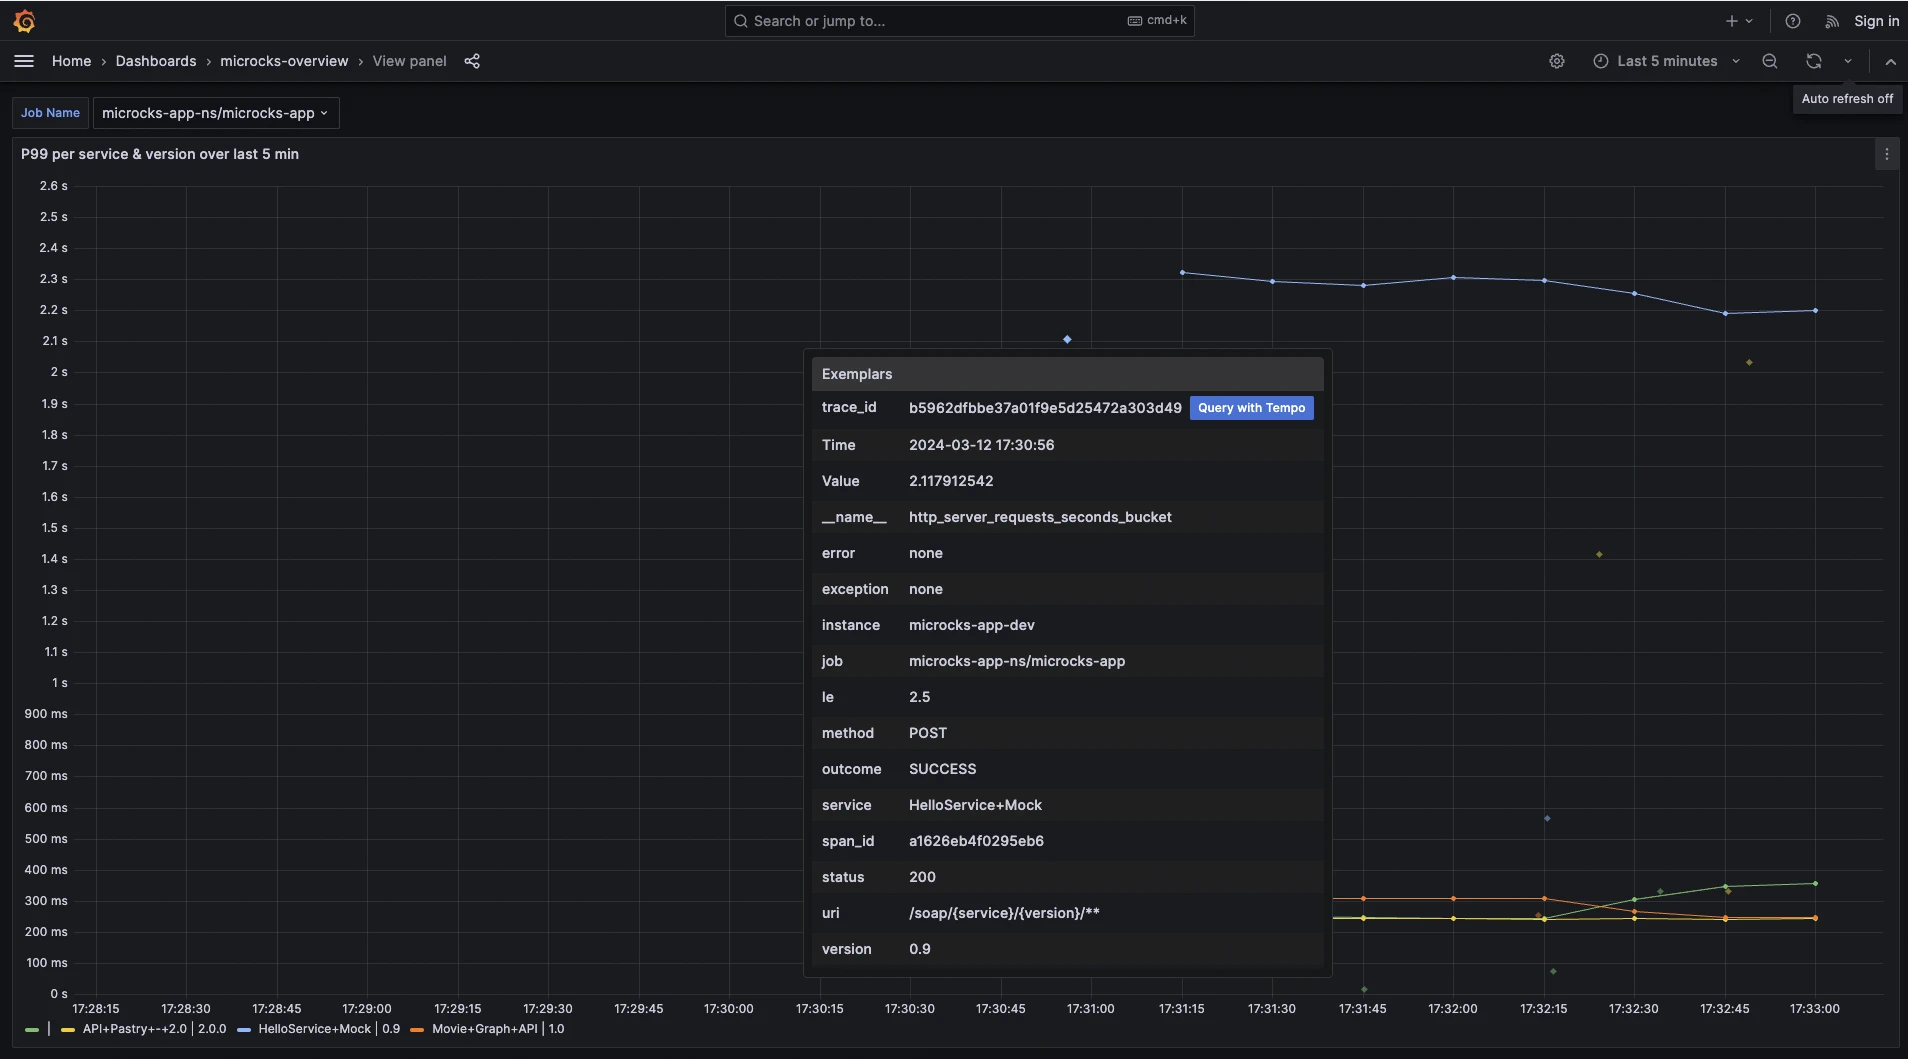
On the bottom pane of the dashboard, you get access to the latest Microcks logs. As you can see, some log lines may be enriched with a traceId by the OpenTelemetry instrumentation. If you have other services calling Microcks instrumented with OpenTelemetry, the traceId is automatically propagated and it’s then possible to jump to these trace details and get the visualization on the full end-to-end trace:
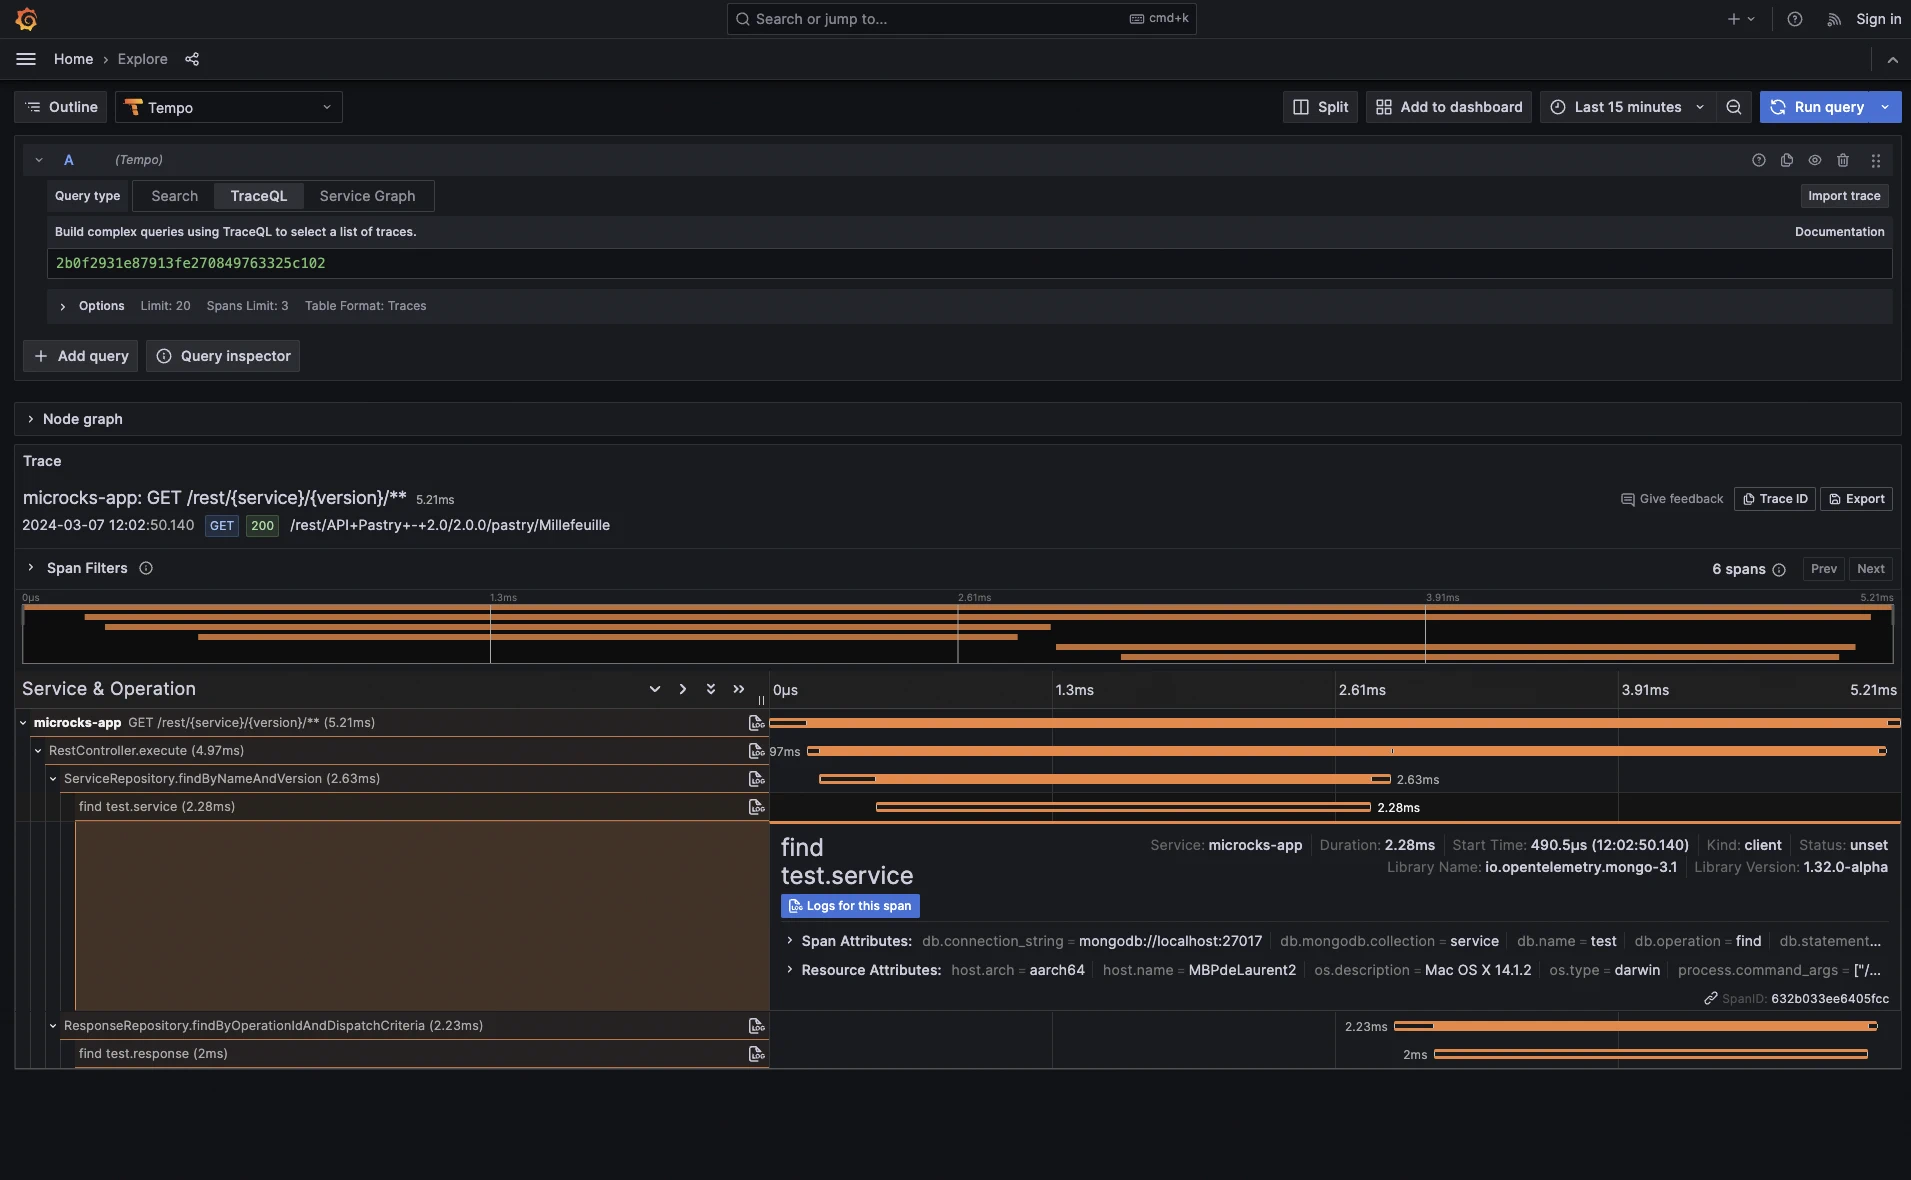
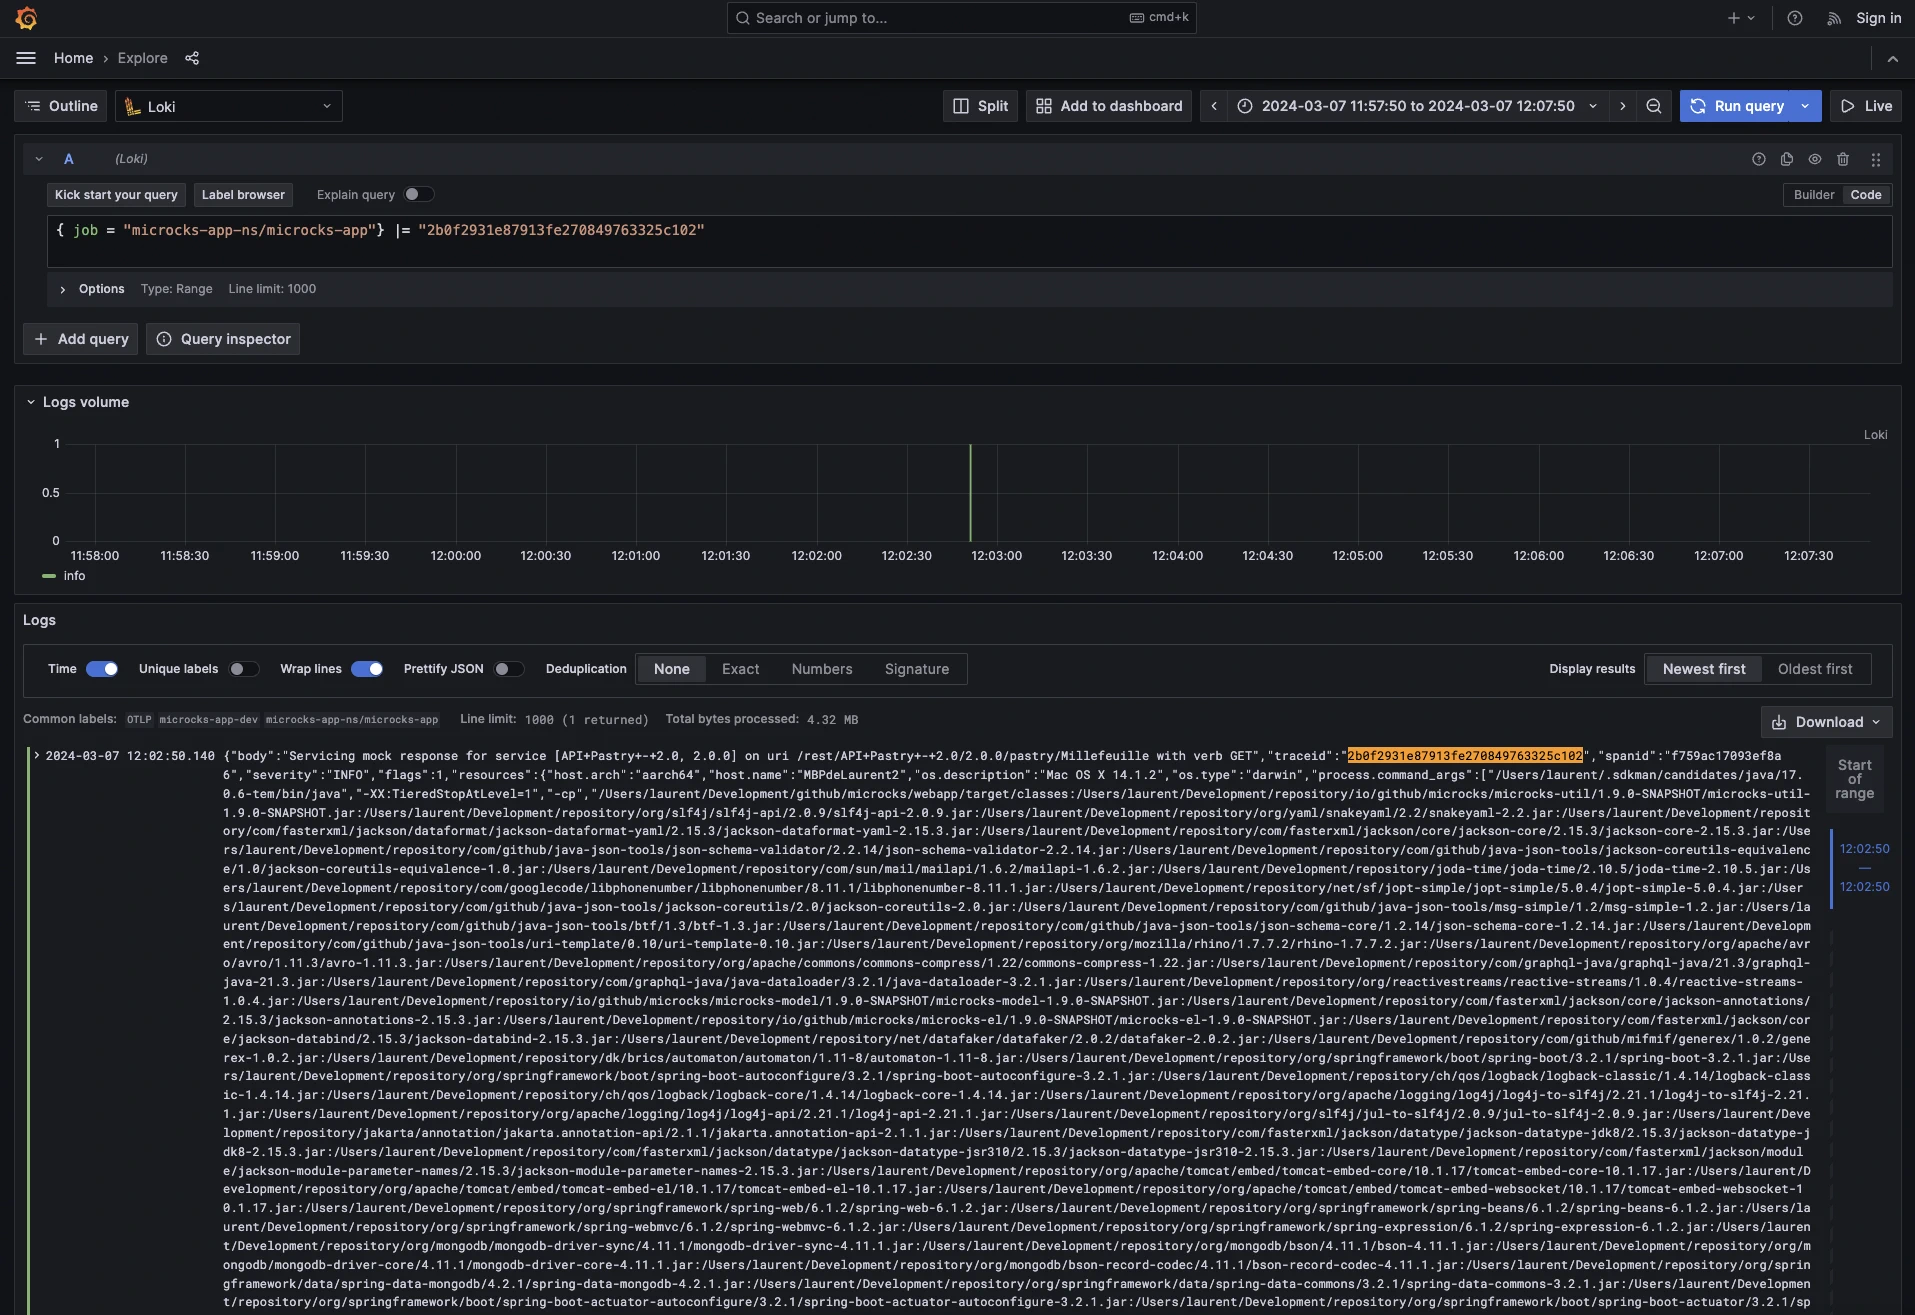
Those traces are the ideal way to diagnose slow components within your services call sequences and check that optimizations work (BTW, Microcks now provides MongoDB optimization hints within the benchmark suite 😉). From every trace, it’s also possible to isolate the log related to a traceID to see the messages that were emitted during a span or the whole trace:
To get the above data and visualizations, we ran the benchmarking suite powered by K6 which launches four different scenarios simultaneously during one minute. Here’s the raw output we got below with details on executed scenarios and raw performance metrics:
docker run --rm -i -e BASE_URL=${MICROCKS_BASE_URL} -e WAIT_TIME=0.1 grafana/k6:${K6_VERSION} run - < bench-microcks.js
          /\     |‾‾| /‾‾/   /‾‾/
     /\  /  \    |  |/  /   /  /
    /  \/    \   |     (   /   ‾‾\
   /          \  |  |\ \ |  (‾)  |
  / __________ \ |__| \__\ \_____/ .io

  execution: local
     script: -
     output: -

  scenarios: (100.00%) 4 scenarios, 85 max VUs, 2m45s max duration (incl. graceful stop):
           * browse: 20 looping VUs for 1m0s (exec: browse, gracefulStop: 30s)
           * invokeRESTMocks: 200 iterations for each of 40 VUs (maxDuration: 2m0s, exec: invokeRESTMocks, startTime: 5s, gracefulStop: 30s)
           * invokeGraphQLMocks: 100 iterations for each of 20 VUs (maxDuration: 2m0s, exec: invokeGraphQLMocks, startTime: 10s, gracefulStop: 30s)
           * invokeSOAPMocks: 5 iterations for each of 5 VUs (maxDuration: 2m0s, exec: invokeSOAPMocks, startTime: 15s, gracefulStop: 30s)

[...]

running (1m04.0s), 14/85 VUs, 10271 complete and 0 interrupted iterations
browse             ↓ [ 100% ] 20 VUs  1m0s
invokeRESTMocks    ✓ [ 100% ] 40 VUs  0m12.7s/2m0s  8000/8000 iters, 200 per VU
invokeGraphQLMocks ✓ [ 100% ] 20 VUs  0m06.9s/2m0s  2000/2000 iters, 100 per VU
invokeSOAPMocks    ✓ [ 100% ] 5 VUs   0m16.0s/2m0s  25/25 iters, 5 per VU

     ✓ status code should be 200
     ✓ pastryCall status is 200
     ✓ eclairCall status is 200
     ✓ eclairXmlCall status is 200
     ✓ eclairXmlCall response is Xml
     ✓ millefeuilleCall status is 200
     ✓ allFilmsCall status is 200
     ✓ aFilmCall status is 200
     ✓ aFilmFragmentCall status is 200
     ✓ andrewCall status is 200
     ✓ karlaCall status is 200
     ✓ karlaCall body is correct
     ✓ laurentCall status is 500
     ✓ laurentCall body is fault

     checks.........................: 100.00% ✓ 46385      ✗ 0
     data_received..................: 132 MB  2.0 MB/s
     data_sent......................: 7.8 MB  122 kB/s
     http_req_blocked...............: avg=40.83µs  min=291ns   med=1.04µs  max=18.4ms   p(90)=5.04µs   p(95)=8.37µs
     http_req_connecting............: avg=33.21µs  min=0s      med=0s      max=18.35ms  p(90)=0s       p(95)=0s
     http_req_duration..............: avg=17.22ms  min=1ms     med=12.57ms max=782.36ms p(90)=28.2ms   p(95)=36.67ms
       { expected_response:true }...: avg=17.21ms  min=1ms     med=12.57ms max=782.36ms p(90)=28.2ms   p(95)=36.66ms
     http_req_failed................: 0.05%   ✓ 26         ✗ 48709
     http_req_receiving.............: avg=80.43µs  min=6.5µs   med=22.66µs max=29.12ms  p(90)=129.29µs p(95)=235.55µs
     http_req_sending...............: avg=15.04µs  min=1.58µs  med=4.95µs  max=9.27ms   p(90)=22.33µs  p(95)=36.83µs
     http_req_tls_handshaking.......: avg=0s       min=0s      med=0s      max=0s       p(90)=0s       p(95)=0s
     http_req_waiting...............: avg=17.12ms  min=902.5µs med=12.49ms max=782.34ms p(90)=28.08ms  p(95)=36.49ms
     http_reqs......................: 48735   756.508316/s
     iteration_duration.............: avg=194.32ms min=10.5ms  med=52.16ms max=5.57s    p(90)=101.2ms  p(95)=177.01ms
     iterations.....................: 10285   159.652981/s
     vus............................: 14      min=14       max=85
     vus_max........................: 85      min=85       max=85


running (1m04.4s), 00/85 VUs, 10285 complete and 0 interrupted iterations
browse             ✓ [ 100% ] 20 VUs  1m0s
invokeRESTMocks    ✓ [ 100% ] 40 VUs  0m12.7s/2m0s  8000/8000 iters, 200 per VU
invokeGraphQLMocks ✓ [ 100% ] 20 VUs  0m06.9s/2m0s  2000/2000 iters, 100 per VU
invokeSOAPMocks    ✓ [ 100% ] 5 VUs   0m16.0s/2m0s  25/25 iters, 5 per VU
And yes, we got this impressive 756.5 hits/second with a p(90) response time of 28.2ms during the bench on a Macbook M2 with a 400MB heap! 🚀
Conclusion
The Microcks user community expressed their wish to know what a single instance of Microcks is able to deliver in terms of throughput and response time. Through contribution we made Microcks ready to be fully observable, and we enabled optimization opportunities for very large-scale deployments. The project and the community users are now able to run benchmarks in autonomy to get figures and have a precise idea of what level of performance Microcks is capable of delivering.
On a personal note, OpenTelemetry is the second-largest CNCF project and it’s a big challenge to navigate in its ecosystem. This has been a good experience to find the nominal path to get the instrumentation, the storage of telemetry data, and visualization up and running for a real project. But, yes! I did it! 💪