

Co-founder of Microcks | Director of Engineering at Postman Open Technologies
Microcks 1.6.0 release 🚀
We are excited to announce the 1.6.0 release of Microcks - the Open source Kubernetes-native tool for API Mocking and Testing. It has been an intense summer time for us as the previous 1.5.2 is just 3 months old!
We’re now “back to work” and happy to release many features that were requested by our community! In a few words, here are the highlights of this new release:
- Governance is certainly a huge topic and you’ll see how Microcks can bring significant insights regarding the Tests Conformance of your API,
- Observability can be tightly linked to Governance as well and Microcks has new APIs to bring you functional and technical observability,
- And of course a lot more: Direct API concepts enhancements and a coming Docker Desktop extension among many others!
Thanks a lot to those who helped push up these significant features once again. Kudos to our amazing vibrant community 👏.
You may notice that this release focus is a bit different than the previous ones. No new protocol, nor new API specification support added… Those were the priority of previous releases where we wanted to validate the internal model of Microcks for mocking and testing - our primary goals. This is mostly done and we can now tackle a new challenge in enhancing quality control and governance features of our solution. Expect to see more of this in the releases to come!
That said, let’s do a review of what’s new in 1.6.0 on each one of our highlights.
Governance with Test Conformance metrics and risk evaluation
You probably already know that Microcks allows you to run Contract or Conformance tests against your API implementation. It helps you get confident you do not break the interface agreed upon with partners nor introduce regression.
But how to easily figure this out at first sight? That’s why we introduced the Conformance index and Conformance score metrics that you can now see on the top right of each API or Service details page:
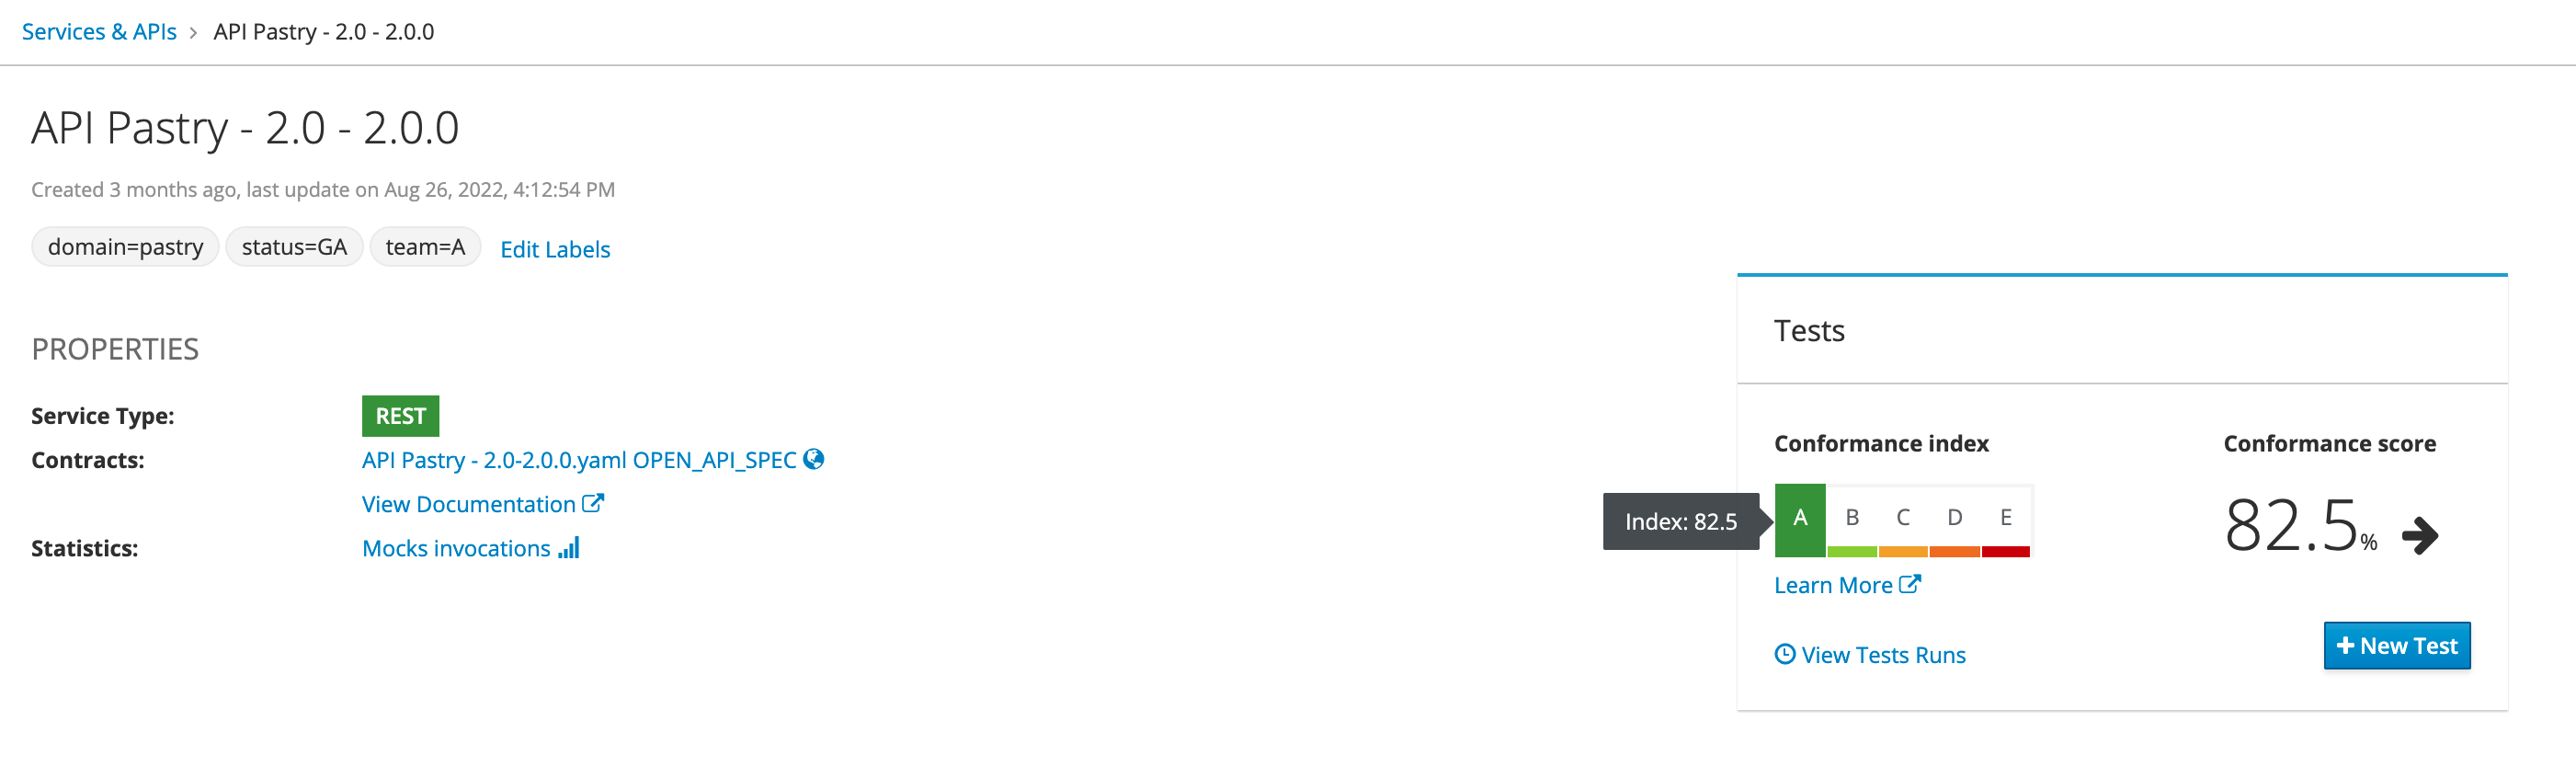
By just checking these visual indicators, you immediately grasp if your tests are comprehensive for conformance validation and what is the current score and trend. What if you start having dozens of APIs or Services in your Microcks repository? The Microcks dashboard has evolved to display aggregated information on that too. Depending on the master level filter you’ve chosen to organize your repository, aggregated Conformance score will be computed and displayed in a tree map. Here is below an example where scores are grouped by domain:
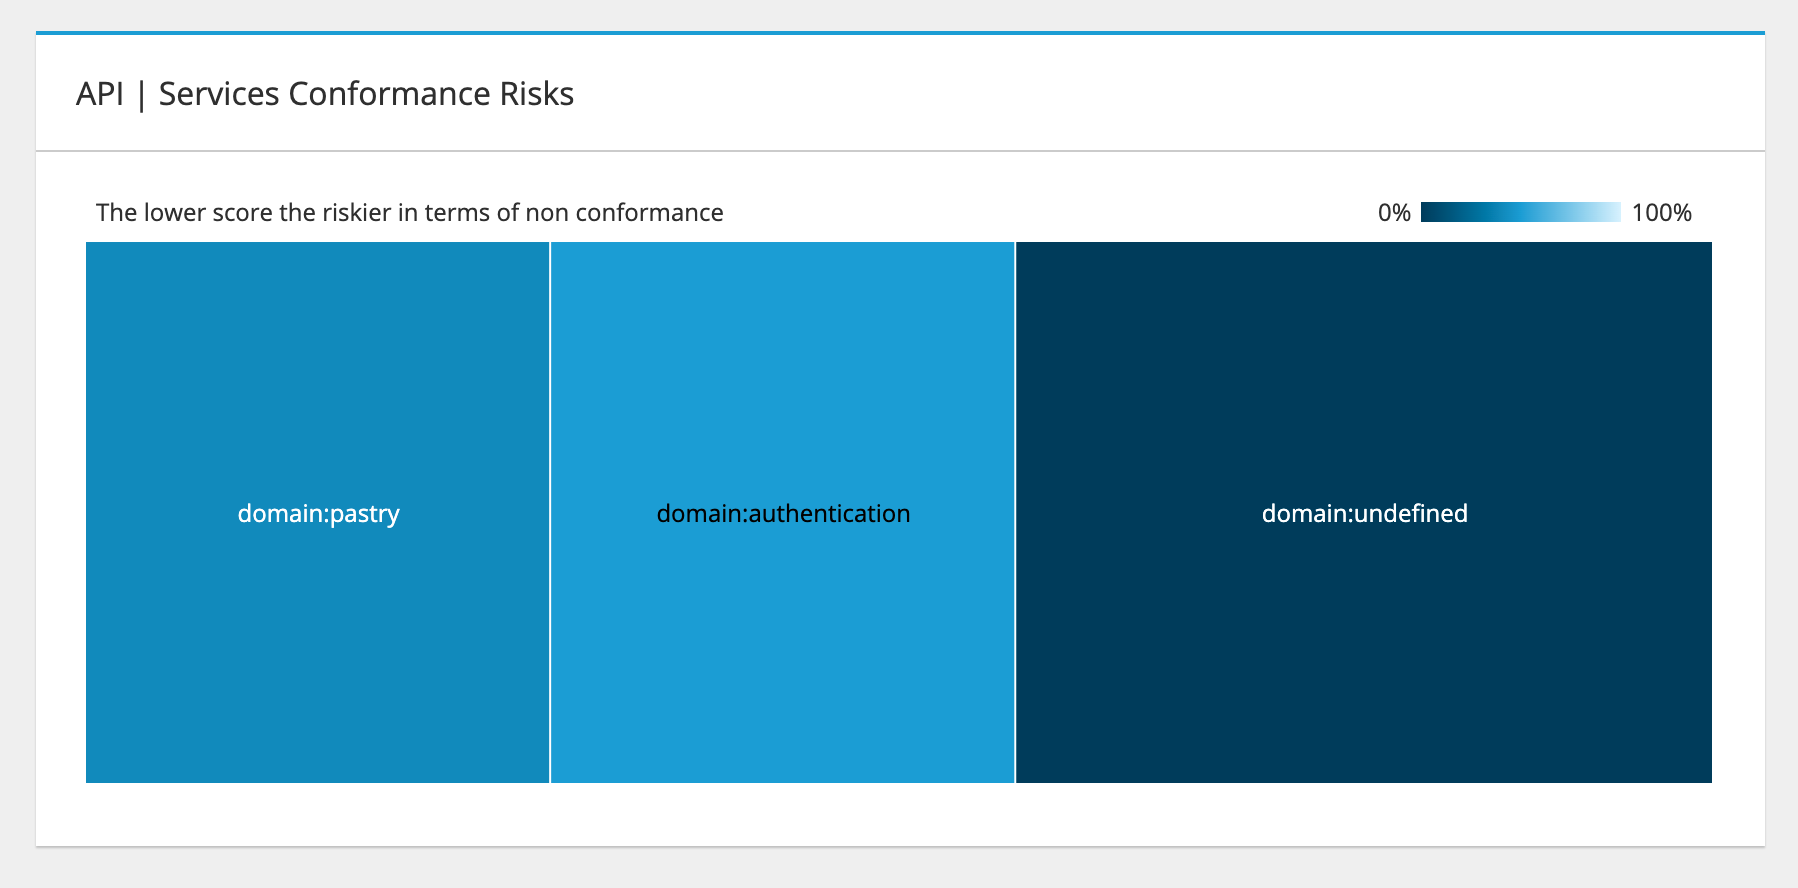
This visualization will allow you to quickly spot the main Conformance risks associated with your API patrimony: bigger rectangles represent bigger groups of APIs and darker rectangles represent the less conformant APIs. You’ll probably want to chase big and dark rectangles 🎯
These metrics and indicators are available for ALL kinds of API! That means that you can now evaluate the risks of a patrimony whatever the API technologies it embeds. Check our documentation on Conformance metrics for more details.
Observe all the things!
Introducing the metrics we talked about earlier has led us to completely review the way we manage observability and give insights to what’s going on into a Microcks instance. We now dissociate two kinds of metrics: the Functional metrics are related to all the domain objects of Microcks and the Technical metrics that are related to resource consumption and performance.
For functional metrics, we introduced a bunch of new API endpoints that return JSON formatted data on how you use Microcks for invoking mocks, executing tests and so on. Here are the main endpoint categories you’ll now find in Microcks own API:
/api/metrics/conformance/*
/api/metrics/invocations/*
/api/metrics/tests/*
For technical metrics, we decided to expose Prometheus compliant endpoints that can be scraped to collect metrics. Because Prometheus format is now a de-facto standard within Cloud Native Computing Foundation, this was an obvious choice to allow integration of Microcks with as many monitoring tools as possible.
Check our full page dedicated to Monitoring & Observability for more details.
More enhancements
Enhanced Direct API
For a long time, Microcks had this feature previously called **Dynamic API **in Microcks: a way to generate a standard API in case you hadn’t an OpenAPI specification at hand. However this was only available for the REST API.
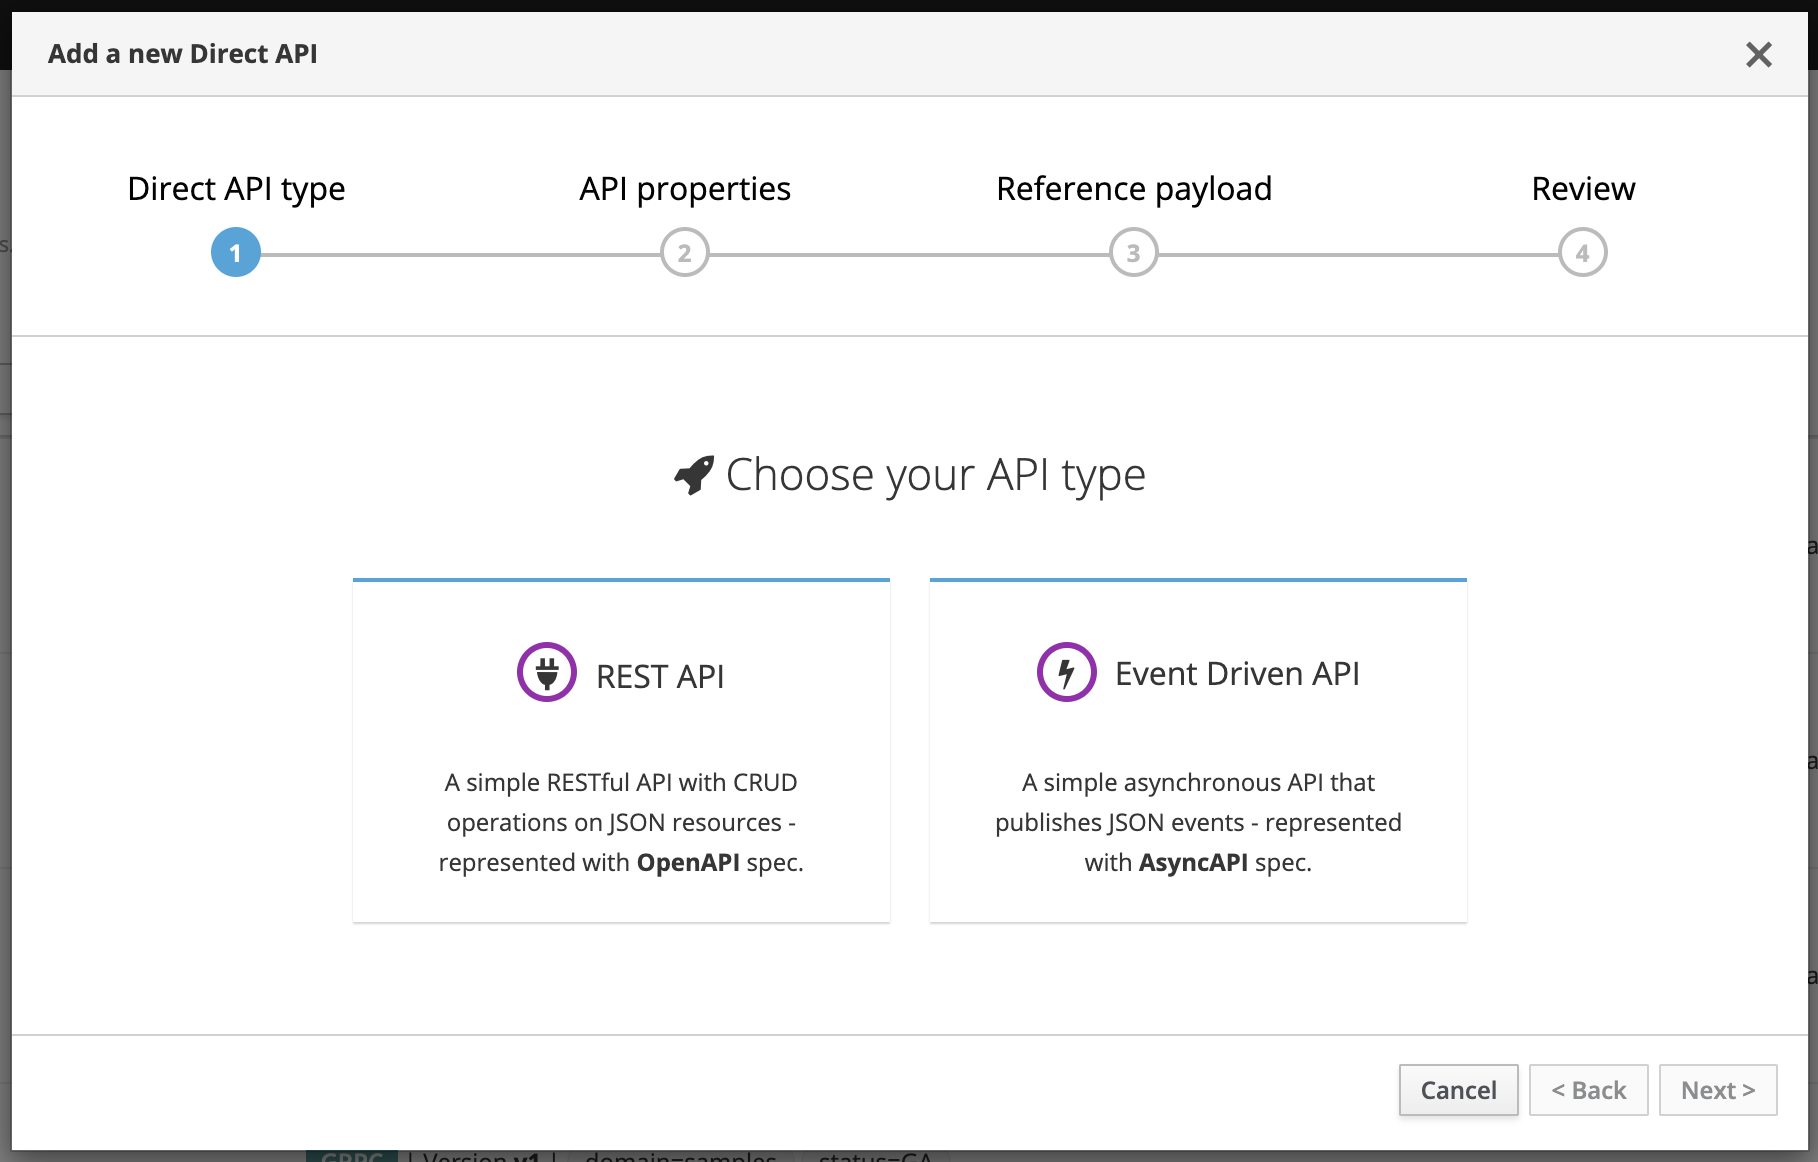
In line with our approach of managing ALL kinds of APIs, we had numerous discussions with community members on how to extend this approach to other protocols. This new release was then the opportunity to reboot this feature and rebrand it as Direct API: a way of directly generating different kinds of APIs without any specification artifact! For 1.6.0 we started to introduce the support of event-driven API through AsyncAPI of course 😉
That means that through a simple wizard, you can now ask Microcks to generate an event-driven API just providing an event sample using JSON. In a few seconds, you’ll have everything you need to quickly on-board: published mock messages on channels and specifications for contract testing and so on 🥷
Event-driven API support for Direct API includes Apache Kafka and Websocket bindings by default; but we also generate a full-blow AsyncAPI specification file with type definition that you may refine or enrich later.
As our engine for Direct API has been fully rebooted, event-driven API support may be just the beginning of a whole new way of bootstrapping API contracts from resources and samples 🤔 Check our Direct API documentation for more details.
Docker Desktop Extension
This is a pretty exciting new feature that will be available in a few weeks but we can’t resist briefly introducing it here 😉
Docker Extensions power up Docker Desktop with new capabilities that can drastically simplify your provisioning and deployment workflow for development tools! We’re excited to announce that Microcks will be very soon available through Docker Extension Marketplace 🚀That means that the experience of getting started with Microcks as a standalone developer instance on your personal laptop will be simpler than ever for Docker users!

This new feature will deserve a full blog post on its own once available. In the meantime, you can check the extension GitHub repository if you want to have a look on what we are cooking there 🧑🍳
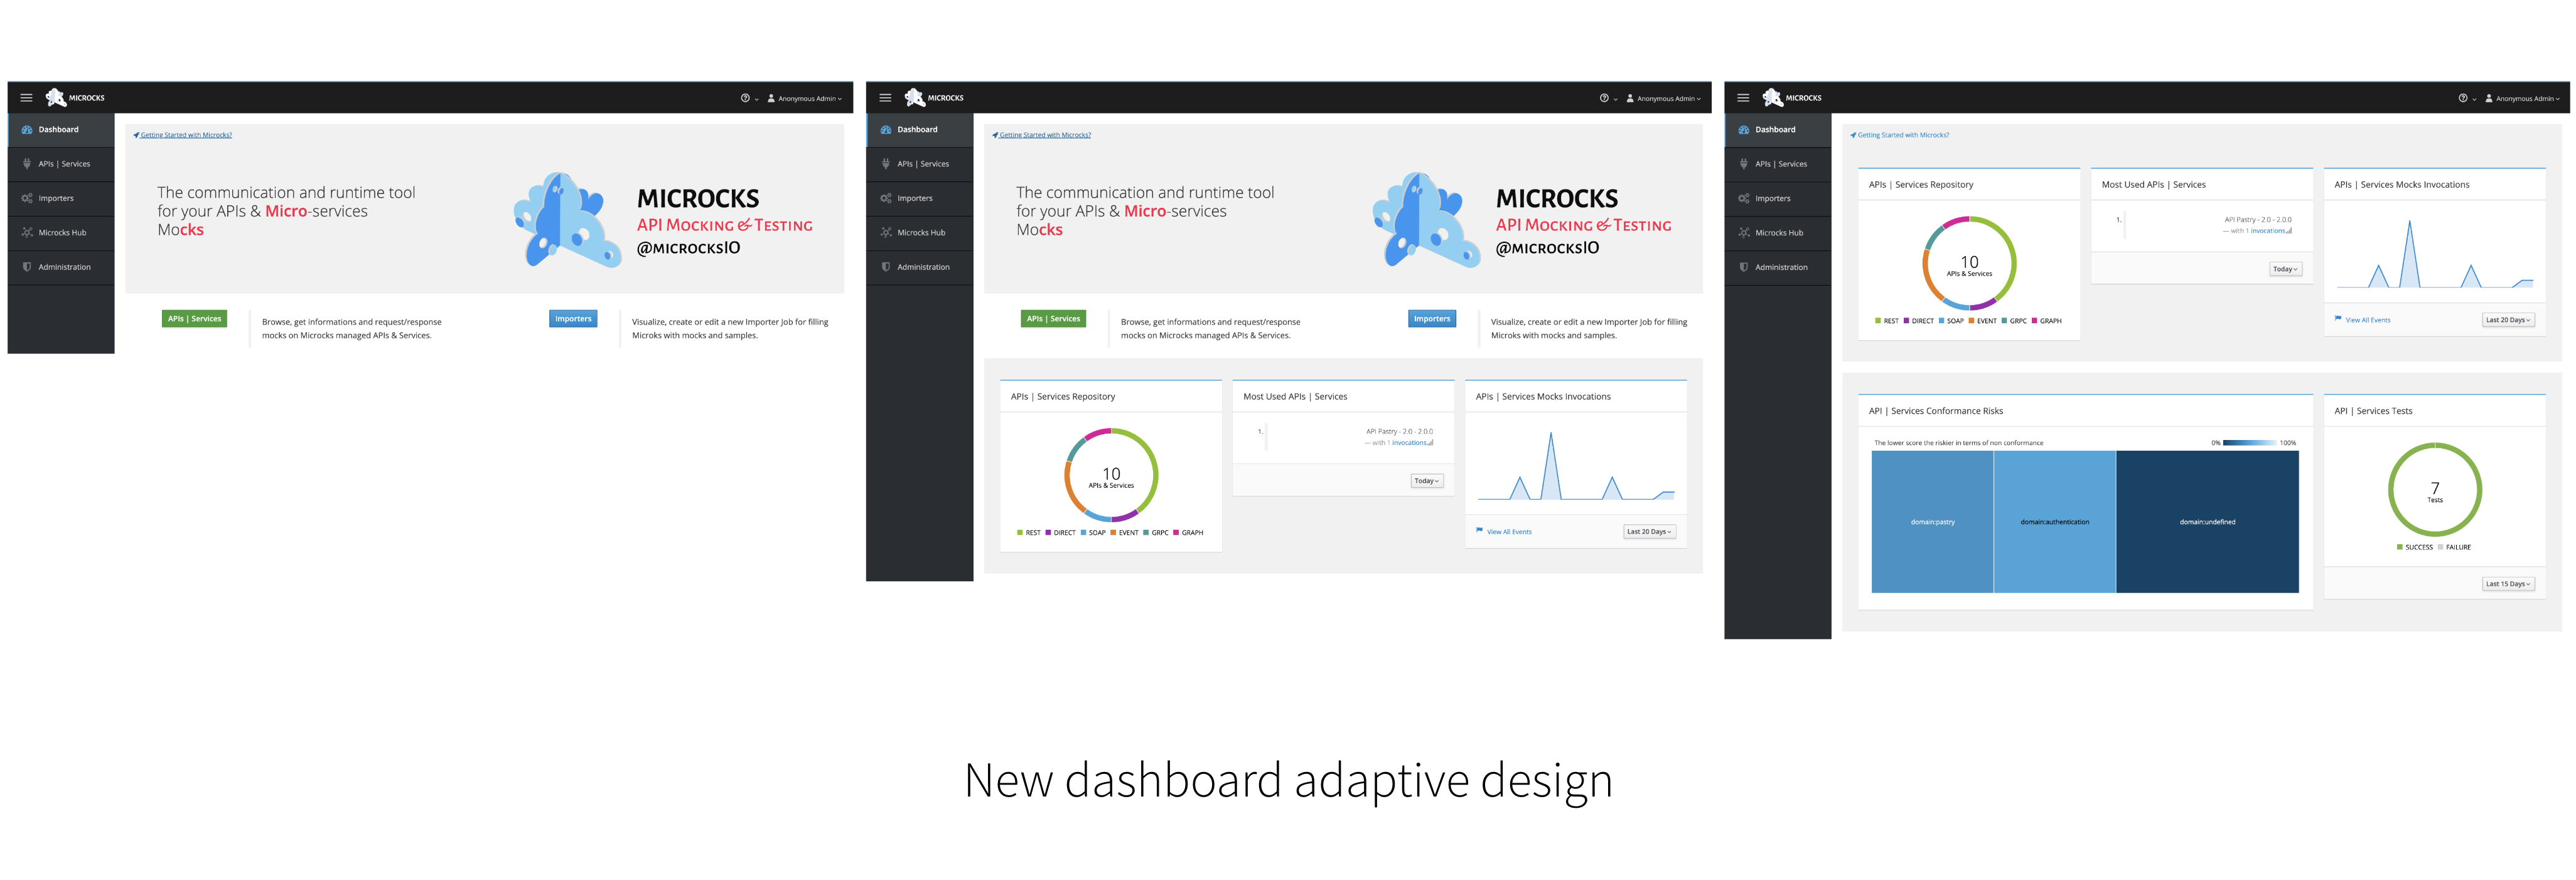
Better dashboard experience
As a consequence of our work on Governance and Observability, we evolved the design of the Microcks dashboard. Experienced users typically ask for more space left to charts and analytics while newcomers typically want to focus on the “Getting Started” action buttons only.
We adopted an adaptive design where the dashboard evolves with the content of your Microcks instance. It only contains larger call-to-action buttons when you start with Microcks, then displays repository and mock usage analytics from the moment you have some APIs to finally reveal test and conformance metrics when you’re actually running tests. With that maturity, _“Getting Started” _buttons can be collapsed.
Thanks to Hugo Guerrero 🙏 for suggesting the enhancements and helping on the color-blind adaptation of the tree map colors 💪
What’s coming next?
As usual, we will be eager to prioritize items according to community feedback: you can check and collaborate via our list of issues on GitHub.
Remember that we are an open community, and it means that you too can jump on board to make Microcks even greater! Come and say hi! on our Github discussion or Discord chat 🐙, simply send some love through GitHub stars ⭐️ or follow us on Twitter, LinkedIn and our YouTube channel!
Thanks for reading and supporting us! ❤️